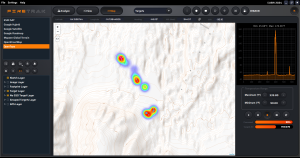
FireTrak Target Heatmaps are visual representations of location data that use color gradients to show the density or frequency of Target points within a specific area. The “hotter” colors (like red or orange) indicate areas with a high concentration of Target points, while “cooler” colors (like blue or green) signify areas with less activity. (Availability in Ver 1.20 or higher)